A YouTube channel audit is a structured check of a channel's health: whether YouTube is showing its videos, whether people click and keep watching, whether the audience comes back, and whether anything (strikes, inconsistency, one viral video) is distorting the picture. For your own channel you do it in YouTube Studio, where the private numbers live. For anyone else's channel you can only use public data, so you audit reach, engagement, consistency and growth instead of watch time and click-through rate.
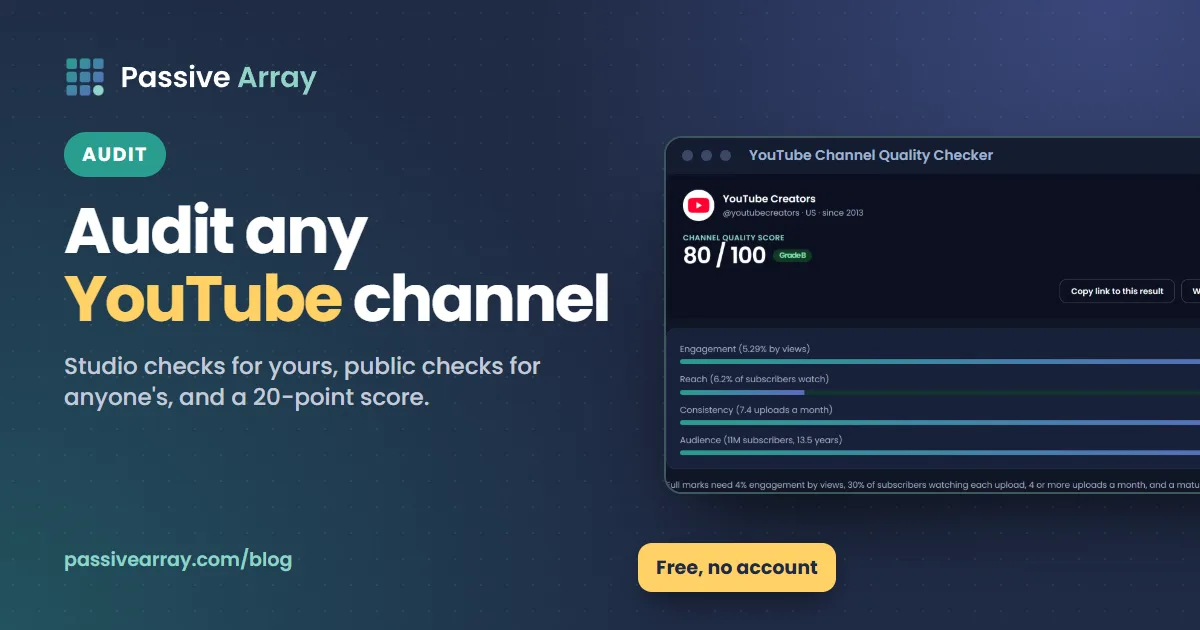
This guide gives you both versions as a step-by-step framework with a scoring checklist, so the audit ends in a number you can compare next quarter, not a page of impressions. For a fast first pass on any channel, the free YouTube channel quality checker scores it from 0 to 100 on engagement, reach, upload consistency and audience, using only public numbers, and shows how every point was earned.
If you only want to know which public numbers exist and how exact they are, start with how to check any YouTube channel's stats. This article goes further: it turns those numbers, and Studio's private ones, into a repeatable audit.
What a YouTube channel audit covers
Every audit, inside or outside, answers the same six questions. Only the evidence changes.
| Question | Own channel: where to look | Any channel: public evidence |
|---|---|---|
| Is the channel in good standing? | Studio dashboard, Channel violations card | Not visible from outside |
| Is YouTube showing the videos? | Impressions, traffic sources | Average views on recent uploads |
| Do people click? | Impressions click-through rate | Not visible from outside |
| Do people keep watching? | Average view duration, retention graph | Not visible; engagement is a weak proxy |
| Does the audience come back? | Returning viewers, watch time from subscribers | Views per subscriber |
| Is it consistent and growing? | Views and subscribers over time | Upload pace, daily growth history |
The outside audit has real blind spots. Watch time, click-through rate, traffic sources, demographics and revenue are only in the owner's Studio. A good outside audit says so instead of pretending.
Before you start: set up a fair comparison
Three rules keep an audit honest.
- Pick a fixed window. For your own channel, compare the last 90 days with the 90 days before. For an outside audit, use the last 10 public uploads, which is what our tools use.
- Compare the channel with itself first. YouTube's Help page on click-through rate says half of all channels and videos fall between 2% and 10%, and advises looking at trends over time rather than single snapshots. The same goes for every metric: your channel's own median is a better baseline than someone else's channel.
- Separate formats. Shorts and long-form videos behave differently. Audit them separately, or at least note which one dominates the window.
One more thing to note for 2026: the YouTube Data API reference says that starting 24 August 2026, a channel's public view count counts views "the moment a video begins to play (includes autoplay, hold the pointer over, and click/tap to play)". If your window crosses that date, expect public view counts after it to run higher than before for the same real interest, and do not read the change as growth by itself.
Part 1: auditing your own channel in YouTube Studio
Work through these steps in order. Each ends with a score for the checklist further down.
Step 1: check standing and alerts
Open the YouTube Studio dashboard. The Channel violations card shows Community Guidelines warnings, strikes and appeal decisions, and the Important notifications card shows channel and video alerts, mainly about monetization and copyright. YouTube says the first violation is typically only a warning, each strike lasts 90 days, and "3 strikes in the same 90-day period may result in your channel being permanently removed from YouTube."
A strike or open copyright problem goes to the top of the audit. Nothing else matters as much while it is active. Copyright claim vs copyright strike explains which issues limit the channel and which only affect one video.
Step 2: reach, or is YouTube showing your videos?
In Analytics, open the Content tab and look at impressions for the window. Then open Advanced mode and compare the two periods. Falling impressions across all videos mean YouTube is offering your videos to fewer people. Rising impressions with falling views point to the packaging problem in Step 3.
Then check traffic sources for the channel. YouTube lists sources such as Browse features, Suggested videos, YouTube search, Shorts, Channel pages, Playlists, End screens and External sources. Note your top two. A channel that gets almost everything from one source is fragile: if that source changes, views drop with it.
Step 3: packaging, or do people click?
Look at impressions click-through rate per video. Sort your videos by CTR and compare the top and bottom quarter with your channel median, not with other channels. YouTube advises factoring in traffic sources when comparing, since search and browse produce different CTRs, and not checking CTR right after upload.
Then review the packaging itself for your five weakest-CTR videos:
- Does the title promise one specific thing, with the important words first?
- Is the thumbnail readable at phone size, with one subject and three words at most?
- Do title and thumbnail say different things that work together?
The free YouTube title analyzer scores title length, keyword position and clarity, which makes this step faster.
Step 4: retention, or do people keep watching?
For each video in the window, check average view duration and the retention graph in the video's Engagement tab. Look for two things: how much of the audience is gone in the first 30 seconds, and where the sharp drops are. If the same kind of moment loses people across several videos (a long intro, a sponsor read at the start, a slow setup), that is a pattern you can fix.
Step 5: audience, or do people come back?
In the Audience tab, check returning viewers and the watch time from subscribers report, which YouTube says "tells you what percent of your watch time comes from subscribers and viewers who aren't subscribed". Then check subscribers gained and lost by day in Advanced mode. Net growth with falling returning viewers means you are adding people who do not stay. Why your subscriber count went down covers how to read losses.
Step 6: content portfolio, or what is working?
List the last 20 uploads with views, CTR and average percentage viewed. Mark each one above or below the channel median on views. Then look for patterns in the winners: topic, format, length, title style. An audit that ends with "make more of these three kinds of video and fewer of these two" has done its job.
Step 7: consistency
Count uploads per month over the window. YouTube says view growth is not correlated with upload frequency, so this is not about posting more. It is about having enough videos to learn from and keeping the promise your audience subscribed for. A long silent gap followed by a burst is worth noting.
YouTube Analytics explained defines every metric used in Part 1 and shows where each one lives in Studio.
Part 2: auditing any channel from public data
Use this for a competitor, a creator you might sponsor, a client's channel before you get Studio access, or a channel you want to learn from. Everything here is public, through the official YouTube Data API.
Step 1: collect the numbers
Paste the channel into the quality checker. It reads the public subscriber count, channel age and the last 10 uploads, then scores:
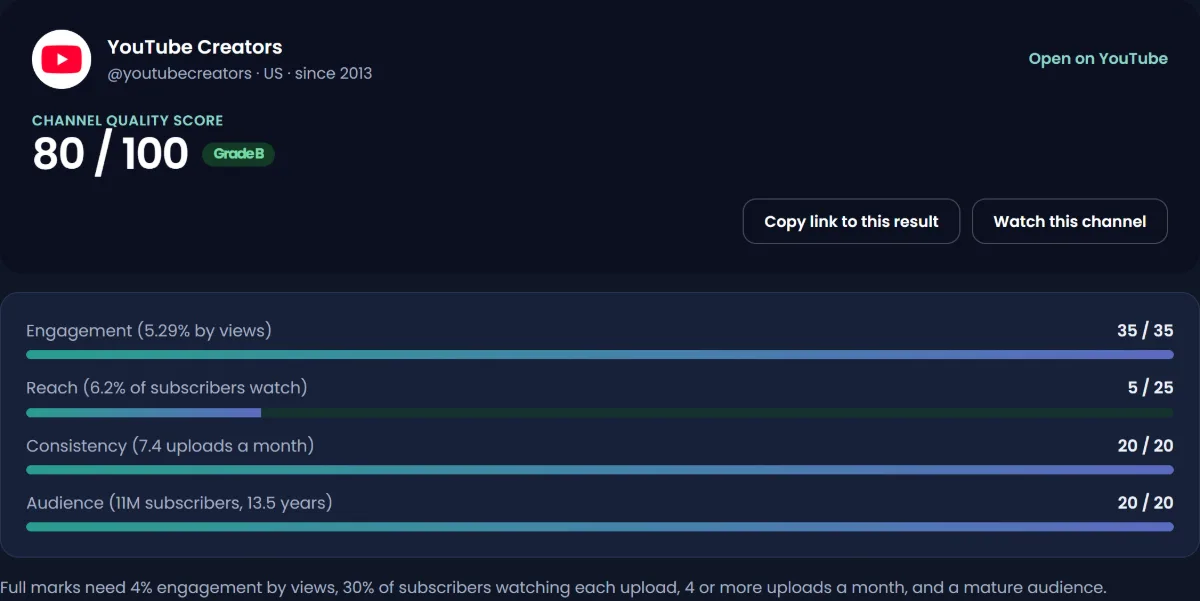
| Part | Points | Measured as | Full marks at |
|---|---|---|---|
| Engagement | 35 | (likes + comments) / views, last 10 uploads | 4% or more |
| Reach | 25 | Average views on last 10 uploads / subscribers | 30% or more |
| Consistency | 20 | Uploads per month from the last 10 upload dates | 4 or more a month |
| Audience size | 12 | Subscribers, log scale | 1 million subscribers |
| Channel age | 8 | 2 points per year | 4 years |
These are Passive Array's scoring choices, not YouTube's. They weight engagement and reach at 60 of the 100 points because those show whether real people watch.
Step 2: engagement
Run the YouTube engagement rate calculator for engagement by views and by subscribers, plus separate like and comment rates. Our scale grades engagement by views as Low under 1%, Below average from 1% to 2%, Average from 2% to 4%, Good from 4% to 6% and Excellent above 6%. YouTube engagement rate benchmarks explains the reasoning. Then read 20 comments on recent videos. Specific comments about the content are a better sign than a high rate made of one-word replies.
Step 3: reach and audience health
Divide average views on recent uploads by subscribers. Views per subscriber shows what the result means at each channel size. A large count with a small share watching usually means an old audience that has drifted away, or a bought one.
Also compare recent average views with lifetime views divided by video count. Recent well above lifetime means momentum. Recent well below means older videos are carrying the channel.
Step 4: growth over time
Public numbers on one day cannot show a trend. Add the channel to the YouTube channel growth tracker, which records its public subscribers, total views and video count daily from the API and shows 7 and 30-day change. Subscriber counts are rounded down to three significant figures for every outside tool, so on a large channel use views gained per day as the precise signal. The history starts on the day the channel was first tracked and is never backfilled.
Step 5: benchmark against peers
Put the channel next to two peers of similar size and topic in compare YouTube channels. It shows subscribers, total views, videos, average views, views per subscriber, engagement by views, average comments, uploads per month and channel age in one table, with the highest value on each row marked. Treat the mark as "highest", not "best": more videos is not automatically better.
Step 6: look for distortions
Before you trust the score, check for the things that bend it:
- One viral video in the last 10. It inflates average views and can lower engagement. Look at the per-video table for an outlier.
- A recent pause. Consistency uses the last 10 upload dates, so check the date of the newest upload.
- Hidden numbers. Comments turned off removes half the engagement formula.
- Mixed formats. A switch between Shorts and long-form changes engagement and views per subscriber on its own.
If you are auditing a creator before paying for a sponsorship, how to vet a creator before you pay them adds the deal-specific checks.
The YouTube channel audit scoring checklist
Score each line 0, 1 or 2 points. The thresholds are our suggested rules, not YouTube's, and they compare the channel mainly with itself.
Own channel (Studio data)
| # | Check | 2 points | 1 point | 0 points |
|---|---|---|---|---|
| 1 | Standing | No warnings or strikes | A warning, no strike | An active strike or unresolved copyright issue |
| 2 | Impressions trend | Up versus previous period | Flat (within 10%) | Down more than 10% |
| 3 | CTR | Most videos at or above channel median | Mixed | Most recent videos below median |
| 4 | Early retention | Most viewers still there at 30 seconds | Some videos lose most viewers early | Most videos lose most viewers early |
| 5 | Retention pattern | No repeated drop pattern | One repeated weak spot | Several repeated weak spots |
| 6 | Traffic mix | No single source above roughly two thirds | One dominant source but growing | One dominant source and falling |
| 7 | Returning viewers | Rising or stable | Slightly falling | Clearly falling |
| 8 | Net subscribers | Positive every month | Positive overall | Negative |
| 9 | Content portfolio | Clear winning formats identified | Some patterns | No pattern, or winners not repeated |
| 10 | Consistency | Steady pace for the whole window | Uneven pace | Long gap or stopped |
Any channel (public data)
| # | Check | 2 points | 1 point | 0 points |
|---|---|---|---|---|
| 1 | Engagement by views | 4% or more | 2% to 4% | Under 2% |
| 2 | Views per subscriber | 30% or more | 10% to 30% | Under 10% (unless search-driven) |
| 3 | Recent vs lifetime average views | Recent higher | About the same | Recent much lower |
| 4 | Upload pace | 4 or more a month, latest upload recent | 1 to 4 a month | Under 1 a month or stopped |
| 5 | Growth trend | Daily views rising over 30 days | Flat | Falling |
| 6 | Outliers | Views spread evenly across recent uploads | One outlier | Score depends on one video |
| 7 | Comment quality | Specific, on-topic comments | Mixed | Generic, repetitive or off-topic |
| 8 | Peer comparison | Leads peers on views per subscriber and engagement | Leads on one | Behind on both |
| 9 | Packaging | Clear, specific titles and readable thumbnails | Inconsistent | Vague or misleading |
| 10 | Focus | Recent uploads serve one clear audience | Two audiences | No clear audience |
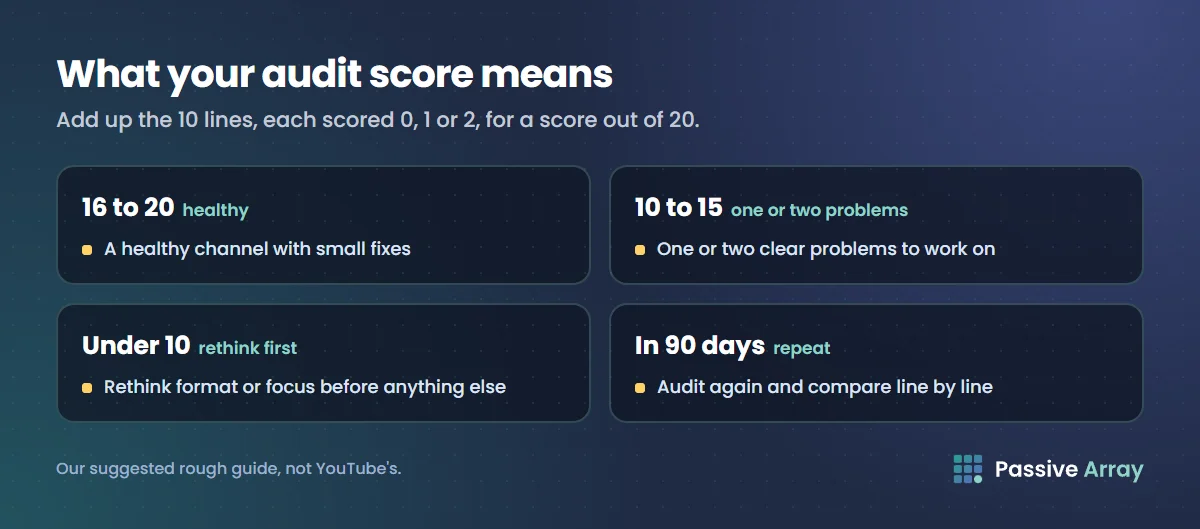
Add up the 10 lines for a score out of 20. As a rough guide: 16 to 20 is a healthy channel with small fixes, 10 to 15 has one or two clear problems to work on, and under 10 needs a rethink of format or focus before anything else. Write the line scores down: a repeat audit in 90 days is only useful if you can compare line by line.
A worked example
Say you audit a channel from outside. These numbers are made up. It has 80,000 subscribers, the last 10 uploads average 6,000 views, engagement by views is 3.1%, and it posts about twice a month. Lifetime views divided by video count is 14,000.
- Engagement 3.1%: 1 point.
- Views per subscriber 7.5%: under 10%, and the channel is not search-driven, so 0 points.
- Recent 6,000 versus lifetime 14,000: recent much lower, 0 points.
- Two uploads a month, latest one last week: 1 point.
- The growth tracker shows daily views flat over 30 days: 1 point.
- Views spread evenly: 2 points. Comments are specific: 2 points.
- Versus two peers it leads on engagement but not on views per subscriber: 1 point.
- Titles clear: 2 points. Recent uploads mix two unrelated topics: 1 point.
Total: 11 out of 20. The audit points to one finding: older videos carry the channel and new uploads reach a smaller share of subscribers, probably because the topic mix changed. That is a specific, testable conclusion, which is the point of an audit.
A YouTube channel audit report template
Keep the report short enough to act on. One page is enough.
- Channel and window. Name, link, dates covered, own or outside audit.
- Score. Total out of 20 and the 10 line scores.
- Three findings. The biggest problems, each with the number that shows it.
- Three actions. One specific change per finding, such as "retest titles on the five lowest-CTR videos" or "go back to the format of the top three videos".
- What the audit could not see. For an outside audit, list watch time, CTR, traffic sources, demographics and revenue as unknown.
- Next audit date. Usually 90 days later, with the same window length.
Once the audit has found the weak spot, how to get more views on YouTube groups fixes by the problem they solve.
Common audit mistakes
- Comparing with famous channels. Their numbers say nothing about your audience. Compare with your own median and with peers of a similar size.
- Trusting one snapshot. One day's numbers can be distorted by a single video. Use a window.
- Treating estimated numbers as data. Earnings, watch time or demographics shown for a channel you do not own are estimates or guesses. Our tools label estimates as estimates.
- Auditing everything and fixing nothing. Pick three actions and measure them at the next audit.
- Reading subscribers first. Subscriber counts are rounded in public and include people who stopped watching years ago. Average recent views tell you more.
Sources
- YouTube Help: Use the YouTube Studio dashboard
- YouTube Help: Community Guidelines strike basics
- YouTube Help: Get started with YouTube Analytics
- YouTube Help: Learn how to use Advanced mode for analytics reports
- YouTube Help: Impressions and click-through rate
- YouTube Help: Traffic sources
- YouTube Help: Understand your YouTube audience
- YouTube Help: YouTube performance FAQ and troubleshooting
- YouTube Data API: Channels resource, statistics
Frequently asked questions
What is a YouTube channel audit?
It is a structured check of a channel's health: standing, reach, click-through, retention, returning audience, content patterns and consistency. The goal is a short list of problems backed by numbers and a matching list of actions, not a general impression.
How do I do a YouTube channel audit for free?
For your own channel, everything you need is in YouTube Studio's Analytics, including Advanced mode. For any other channel, free tools such as our channel quality checker, engagement rate calculator, channel comparison and growth tracker read the public numbers from the official YouTube API. Use the 20-point checklist above to score the result.
Can I see the analytics of other YouTube channels?
Only the public numbers: subscribers (rounded), total views, video count, and views, likes and comments per video. Watch time, click-through rate, traffic sources, demographics and revenue are visible only to the channel owner in Studio. Any site showing them for someone else's channel is estimating.
What is the best YouTube channel audit tool?
For your own channel, YouTube Studio, because it is the only source of watch time, CTR and traffic data. For outside audits, any tool that uses the official API sees the same public data, so choose one that shows how it calculates each score. Ours shows every point of the quality score and its raw figure.
How often should I audit my YouTube channel?
Every 90 days works well for most channels: long enough for several uploads to mature, short enough to catch a decline early. Use the same window length each time so the scores are comparable.
When does YouTube channel analytics update?
YouTube Studio's Realtime report gives early data on recent uploads and lets you compare the last 60 minutes with the last 48 hours. Other reports take longer to settle, so audit a period that ended at least a few days ago. Public view counts on outside tools depend on how often each tool refreshes.
What should a YouTube channel audit report include?
The channel and time window, a score with line-by-line results, the three biggest findings with their numbers, one action per finding, what the audit could not see, and the date of the next audit. One page is enough.