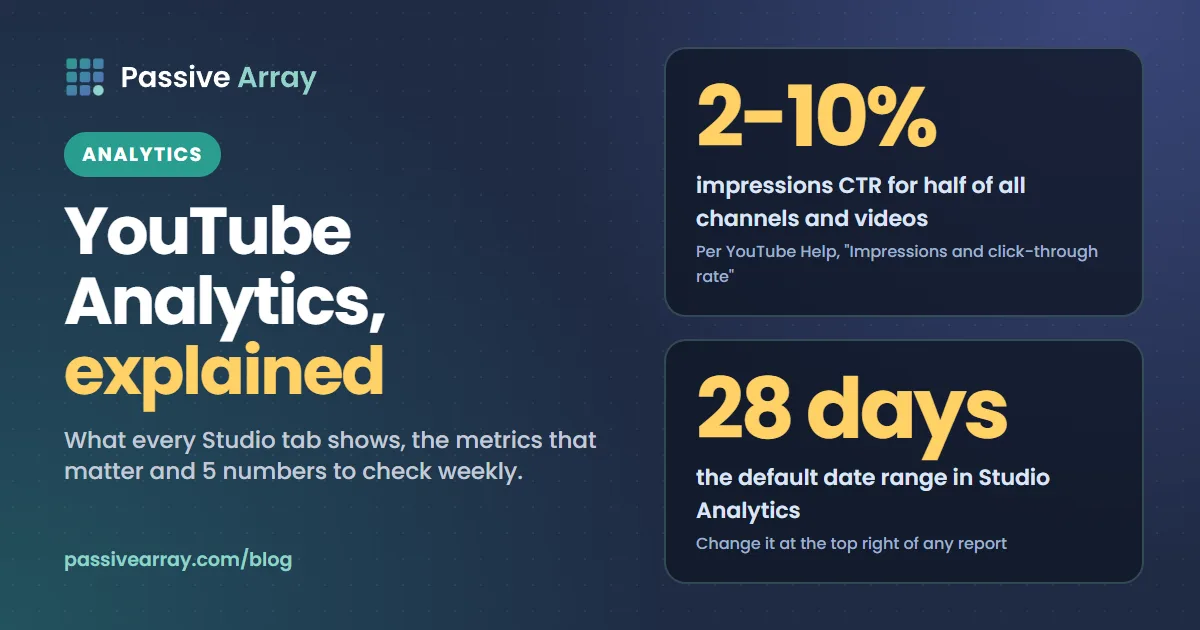
YouTube Analytics lives in YouTube Studio, under Analytics in the left menu. It shows how your channel and each video perform: how often YouTube showed them, how many people clicked, how long they watched, who they are, where they came from and, once you are monetized, what you earned. The metrics that matter most are impressions, impressions click-through rate, average view duration, returning viewers and traffic sources. Read together, they tell you whether a video is not being shown, not being clicked or not being watched.
This guide explains every tab, defines each key metric in YouTube's own terms, shows how to read them together with a worked example, and ends with five numbers to check every week. It is about your own channel. To see the public stats of someone else's channel, read how to check any YouTube channel's stats.
YouTube has been redesigning Studio gradually through 2026, so the layout on your account may differ slightly from this description. The metric definitions do not change with the layout.
Where to find YouTube Analytics
- Channel analytics: open YouTube Studio, then choose Analytics in the left menu.
- Video analytics: in Studio, open Content, hover over a video and choose the Analytics icon.
- On your phone: the YouTube Studio app shows the same core reports in a simpler layout. Advanced mode is easier on a computer.
- Advanced mode: the link at the top right of any analytics page opens an expanded report. You can compare periods, filter by video, format, country or traffic source, group videos, and export to a spreadsheet.
Change the date range at the top right. The default is the last 28 days. For a single video, the first 7 days and the lifetime view are usually the most useful.
The channel tabs
| Tab | What it shows | Use it to answer |
|---|---|---|
| Overview | Views, watch time, subscribers and revenue for the period, Realtime activity and your top content | "Is the channel up or down?" |
| Content | Results split by format: videos, Shorts, live streams and posts, with impressions, CTR and traffic sources | "Which format and which videos are working?" |
| Audience | Returning and new viewers, unique viewers, countries, age, gender, other channels and content your viewers watch, and when they are on YouTube | "Who watches, and are they coming back?" |
| Revenue | Estimated revenue, RPM, CPM and revenue sources, once you are in the Partner Program | "What do I earn, and from where?" |
| Trends | What viewers search for on YouTube, including your audience's searches over the last 28 days | "What should my next video be about?" |
Overview
The Overview tab is the summary. Its most useful card is Realtime, which shows views in the last 48 hours and the last 60 minutes. Realtime numbers are estimates and can change once YouTube finishes processing. The other useful card is typical performance, which ranks your latest video against your usual results for the same time since publishing. It is a fairer comparison than raw view counts, because a video two days old cannot be compared with one two years old.
Content
The Content tab splits results by format. This matters because Shorts and long-form videos behave very differently: Shorts are watched in a swipe feed and long-form videos are chosen from thumbnails. Look at each format separately, or Shorts views will hide what is happening to your long-form videos, and the other way round.
Audience
The Audience tab answers who is watching. Its most important cards are returning and new viewers, unique viewers and When your viewers are on YouTube. It also shows the other channels and content your audience watches, which are some of the best free research data you will find, because they show what else your actual viewers choose.
Revenue
The Revenue tab appears once you are in the YouTube Partner Program. It shows estimated revenue, RPM (your revenue per 1,000 views, after YouTube's share, from all sources) and CPM (what advertisers paid per 1,000 ad impressions, before YouTube's share). It also breaks revenue down by source: watch page ads, Shorts feed ads, YouTube Premium, memberships, Supers and shopping. Why is my YouTube RPM low explains the gap between RPM and CPM, and YouTube CPM by niche explains why some topics pay more.
Trends
The Trends tab shows what people are searching for on YouTube, including searches made by your own audience. Use it to find topics your viewers already want. It is the closest thing Studio has to a keyword tool. Our keyword generator adds the long-tail phrases people type into the search box.
The video tabs
Each video has its own analytics, with five tabs.
| Tab | Key reports |
|---|---|
| Overview | Views, watch time, subscribers and revenue for this video, and how it compares with your typical results |
| Reach | Impressions, impressions CTR, traffic sources, and the YouTube search terms that found the video |
| Engagement | Watch time, average view duration, the retention graph and Key moments for audience retention, plus end screen and card clicks |
| Audience | Returning and new viewers for this video, countries, age and gender |
| Revenue | Estimated revenue, RPM and CPM for this video |
Two video reports deserve special attention.
Search terms, in the Reach tab under YouTube search, shows the exact phrases people typed before watching. If the terms do not match what you thought the video was about, rewrite the title and description for the terms people actually use.
Key moments for audience retention, in the Engagement tab, shows how well each part of the video held attention. YouTube lets you compare it with your typical retention, based on your 10 latest videos of similar length. It marks the intro, the top moments where viewers rewatched, spikes and dips.
The metrics that matter, defined
Impressions
How many times YouTube showed your thumbnail to a viewer, on Home, in suggested videos, in search, in subscriptions and elsewhere on YouTube. YouTube notes that not every time a thumbnail appears counts as an impression, and that impressions on external websites or end screens are not included. Impressions tell you how much YouTube is offering your video to people.
Impressions click-through rate (CTR)
The share of impressions that turned into a view. YouTube says half of all channels and videos have an impressions CTR between 2% and 10%. It also says that "if a video gets a lot of impressions (such as if it appears on the Home Page), it's natural for the CTR to be lower." So a falling CTR on a growing video is normal: the video is reaching people who know you less.
Compare CTR between your own videos of the same type, not with other channels. The title analyzer and thumbnail tester help with the two things that drive it.
Watch time
Total hours viewers spent watching. It matters for two reasons. It is one of the signals YouTube's recommendations use, and long-form public watch hours count towards the Partner Program. YouTube monetization requirements covers the thresholds.
Average view duration and average percentage viewed
Average view duration is the average number of minutes watched per view. Average percentage viewed is the same thing as a share of the video's length. YouTube says both are signals: the percentage matters more for short videos, the duration more for long ones. For Shorts, both are calculated from engaged views.
The retention graph
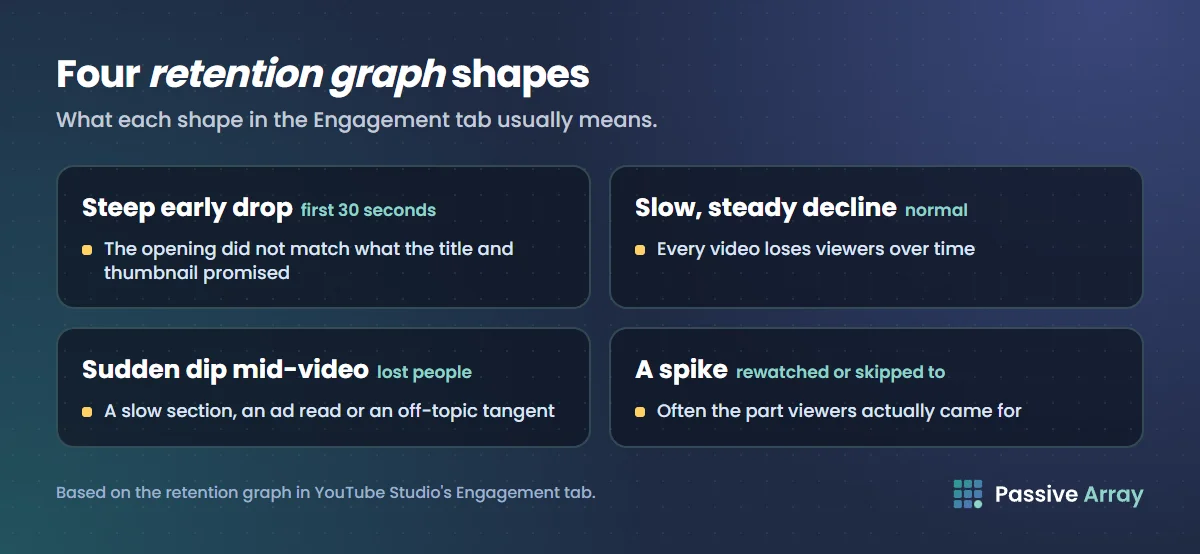
The line in the Engagement tab shows the share of viewers still watching at each moment. Four shapes to recognize:
- A steep drop in the first 30 seconds. The opening did not match what the title and thumbnail promised.
- A slow, steady decline. Normal. Every video loses viewers over time.
- A sudden dip in the middle. Something lost people there: a slow section, an ad read, an off-topic tangent.
- A spike. People rewound to rewatch, or skipped ahead to that moment. Spikes often show the part viewers actually came for.
Views and engaged views
Since 24 August 2026, YouTube counts a view the moment a video starts to play, across all formats. The Partner Program still uses engaged views and engaged watch hours. How YouTube counts views explains the difference, and why your Studio numbers and public count can differ.
Unique viewers
An estimate of how many different people watched in the period, counting each person once even if they watched on several devices. Comparing views with unique viewers tells you how many videos each viewer watches.
New, casual and regular viewers
New viewers watched your channel for the first time in the period. Returning viewers had watched before. YouTube splits returning viewers into two groups:
- Regular viewers have watched a video on your channel at least once a month for more than six months of the past year. YouTube calls them your most loyal audience.
- Casual viewers watch your channel occasionally.
YouTube notes that these segments do not affect reach or monetization. They describe your audience, they do not change how it is served. A growing number of regular viewers is still the strongest sign of a healthy channel, because they are the people who watch whatever you publish next. Regular viewers are a high bar, so small percentages are normal, especially on new or Shorts-led channels.
Subscribers
Studio shows subscribers gained and lost, and which videos brought new ones. A video that brings in many subscribers per view is a guide to what new viewers want more of.
Traffic sources
Traffic sources show where views came from. The main ones, as YouTube defines them:
| Source | Where the viewer came from |
|---|---|
| Browse features | Home, Subscriptions, Watch later and other browsing areas |
| Suggested videos | Suggestions beside or after other videos, and links in video descriptions |
| YouTube search | YouTube search results |
| Shorts | The Shorts vertical feed |
| Channel pages | Your channel page or other channels' pages |
| Playlists | Any playlist containing the video, including other people's |
| Notifications | Notifications and emails sent to subscribers |
| End screens | Your end screens |
| External | Websites and apps that embed or link to the video |
| Direct or unknown | Typed URLs, bookmarks, signed-out viewers and unidentified apps |
Each source tells a different story. Search traffic means your title answers what people type. Suggested traffic means your video works next to others in your niche. Browse traffic means YouTube is putting you on people's Home page. If one source falls, you know where to look.
How to read the numbers together
One metric on its own rarely explains anything. Read them in the order a viewer meets your video: shown, clicked, watched.
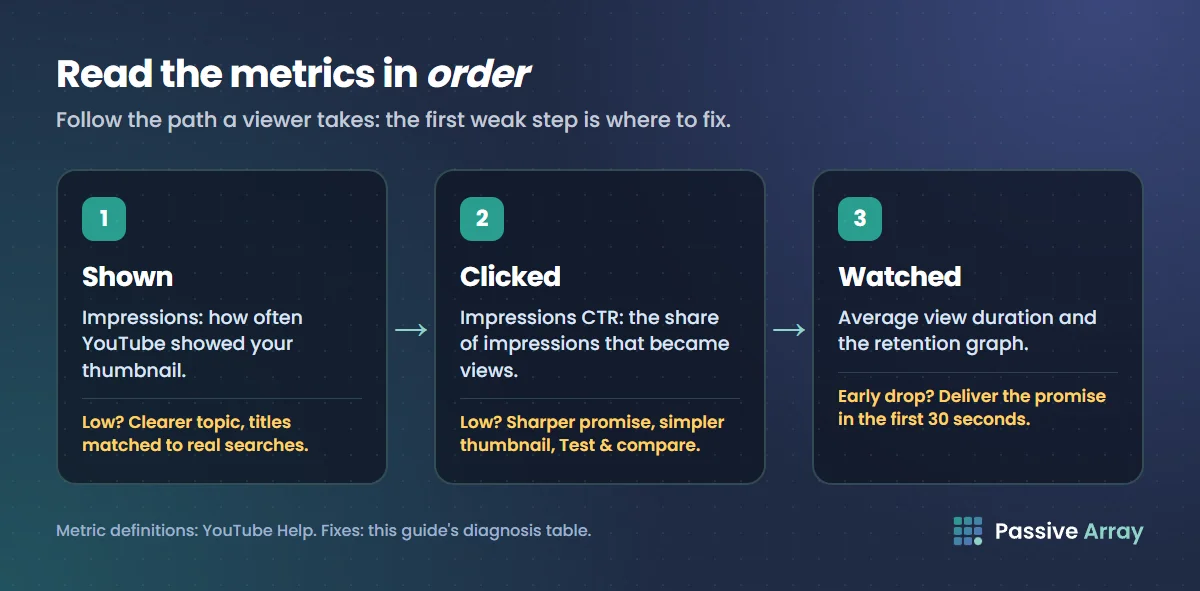
| What you see | Likely problem | What to try |
|---|---|---|
| Low impressions | YouTube is not showing the video much | A clearer topic for one audience, a title matched to real searches, links from your other videos |
| Good impressions, low CTR | The title and thumbnail are not convincing | A sharper promise, a simpler thumbnail, a Test & compare run |
| Good CTR, steep early drop in retention | The opening does not match the click | Deliver the promise in the first 30 seconds |
| Good retention, few impressions | Viewers like it, but too few were shown it | More videos on the same topic, so YouTube learns who it suits |
| Many new viewers, few returning | People find one video but not the channel | Series, playlists, end screens to related videos |
A worked example
Here is an example with made-up numbers, to show the method.
A cooking channel posts a video. After 7 days, Studio shows 40,000 impressions, a CTR of 2.1% and an average view duration of 6:10 on a 9-minute video. The channel's typical CTR is about 5%, and its typical duration on similar videos is 4:30.
- Impressions are healthy. YouTube is offering the video.
- CTR is far below normal. People see it and do not click.
- Duration is above normal. The people who do click enjoy it.
So the video is good and the packaging is not. The fix is a new title or thumbnail, not a new video. Running Test & compare with two alternatives would show which works. If the duration had been poor too, the problem would be the topic or the opening, and changing the thumbnail would not help.
Five numbers to check every week
- Views and watch time against your typical week. Use the typical performance card, not raw totals.
- CTR on your last three videos. If one is well below your others of the same format, change its title or thumbnail.
- The first 30 seconds of the retention graph on your latest video. A steep drop means the opening did not match the title.
- Returning and regular viewers. Rising means people come back for you, not just for one video.
- The top traffic source for your newest video. It tells you whether YouTube is recommending it or only your subscribers watched.
That takes ten minutes. Most of the rest of Analytics is for diagnosing a specific problem once these five have shown you one.
What analytics cannot tell you
Analytics measures behaviour, not reasons. A low CTR could be the thumbnail, the title or simply a topic your audience does not want. Change one thing at a time and compare.
Small numbers are noisy. A video with a few hundred impressions can swing from 3% to 9% CTR by chance. Wait for a few thousand impressions before drawing conclusions.
Revenue figures are estimates. Studio shows estimated revenue. The amount you are paid is finalized at the start of the next month. How and when YouTube pays you explains the timing.
It only shows your own channel. No one can see another channel's Studio analytics. To compare yourself with others, use public numbers. The growth tracker records any channel's subscribers and views daily. The engagement rate calculator compares likes and comments per view, and YouTube engagement rate benchmarks show what is typical.
Sources
- YouTube Help: Impressions and click-through rate
- YouTube Help: Traffic sources
- YouTube Help: Understand your YouTube engagement
- YouTube Help: Understand new, casual and regular viewers
- YouTube Help: YouTube performance FAQ and troubleshooting
Frequently asked questions
How do I see analytics on YouTube?
Open YouTube Studio on a computer or in the Studio app and choose Analytics. For one video, go to Content and choose the Analytics icon next to it. Analytics is only available for channels you own or manage.
What is a good click-through rate on YouTube?
YouTube says half of all channels and videos have an impressions CTR between 2% and 10%. What counts as good depends on your niche, format and where impressions come from. Compare each video with your own recent videos of the same type.
Can I see the analytics of other YouTube channels?
No. Studio analytics are private to each channel. You can see public numbers for any channel: subscribers, views, upload dates, likes and comments. The growth tracker records those daily so you can see a channel's growth over time.
What is the difference between views and unique viewers?
Views count every play. Unique viewers estimate how many different people watched, counting each person once across devices. If you have 10,000 views from 4,000 unique viewers, the average viewer watched two or three times.
What are subscriber analytics on YouTube?
Studio shows subscribers gained and lost in the period, and which videos and traffic sources brought new subscribers. The Audience tab also shows how much of your watch time comes from subscribers and non-subscribers.
Why do my Studio views differ from the public view count?
The two are processed at different speeds and Studio can filter by period, format and source. YouTube can also remove views it finds invalid. Small differences are normal, especially in the first days after upload.
Do returning or regular viewers affect my reach?
No. YouTube says audience segments such as casual and regular viewers do not affect reach or monetization. They are a way to understand your audience, not a ranking signal.
Which YouTube metric matters most?
There is no single one. For a new video, impressions CTR and the first 30 seconds of retention show whether the packaging and opening work. For the channel, growth in returning and regular viewers shows whether people come back.
By Nasir Uddin, founder of Passive Array. Rules and figures checked Oct 29, 2026.