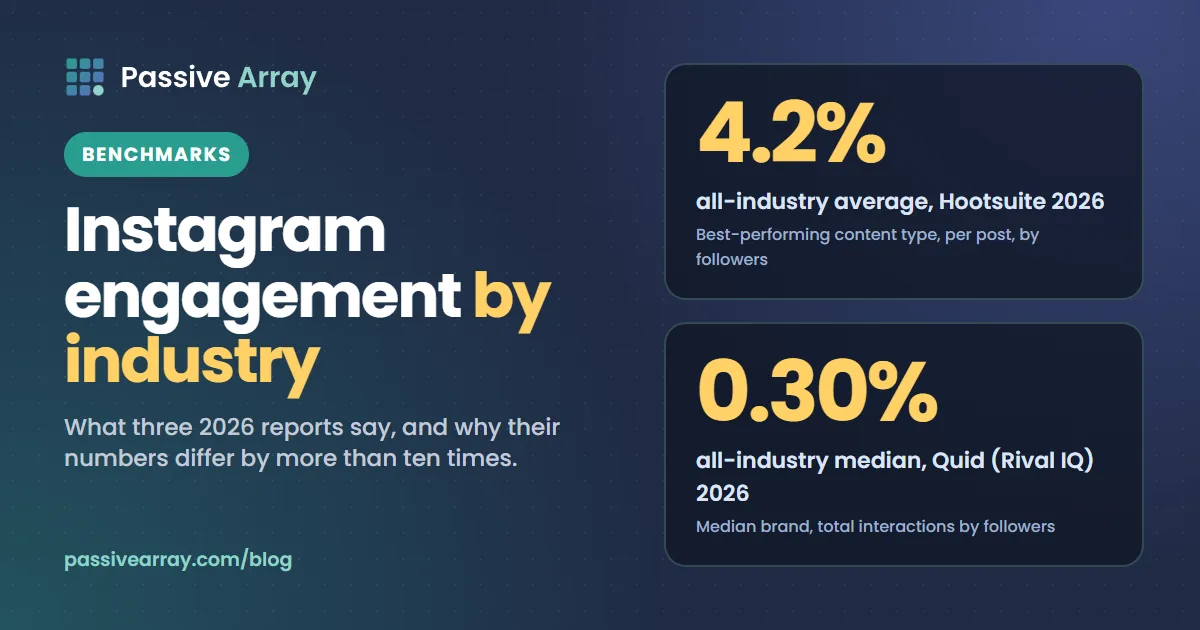
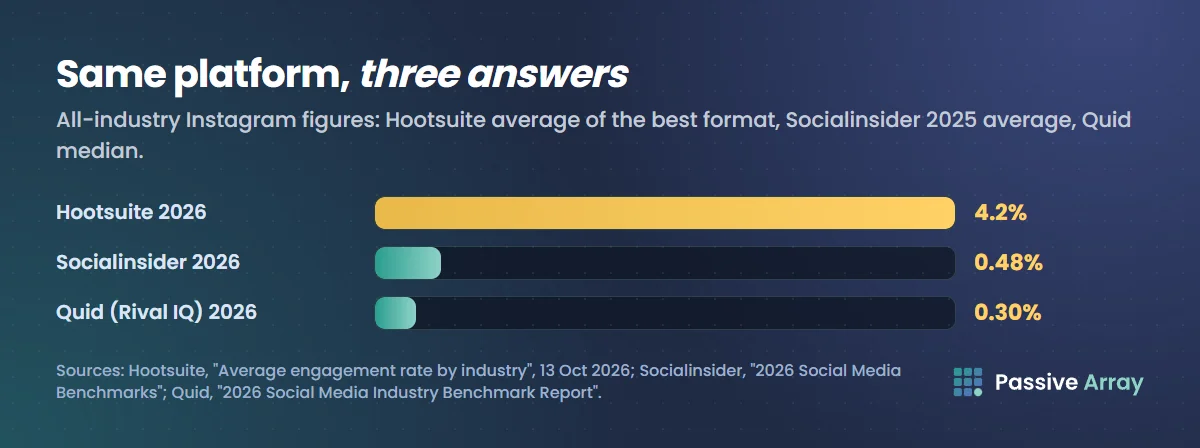
The average Instagram engagement rate by industry depends heavily on which report you read. In 2026, Hootsuite puts the all-industry Instagram average at 4.2%, with industries ranging from 3.2% to 5.5%. Quid's benchmark report (formerly Rival IQ) puts the all-industry median for brands at 0.30%. Socialinsider reports 0.48% for 2025. All three divide by followers, yet the highest figure is fourteen times the lowest, because they measure different posts, different accounts and different kinds of engagement.
So a "good" rate only means something next to a benchmark measured the same way. This guide sets out what each report says, explains why they disagree, and shows how to compare your own number fairly. To place a rate against typical figures for an account's size, use the Instagram engagement rate benchmark tool; for brands, compare against the industry figures below using the same formula as the report.
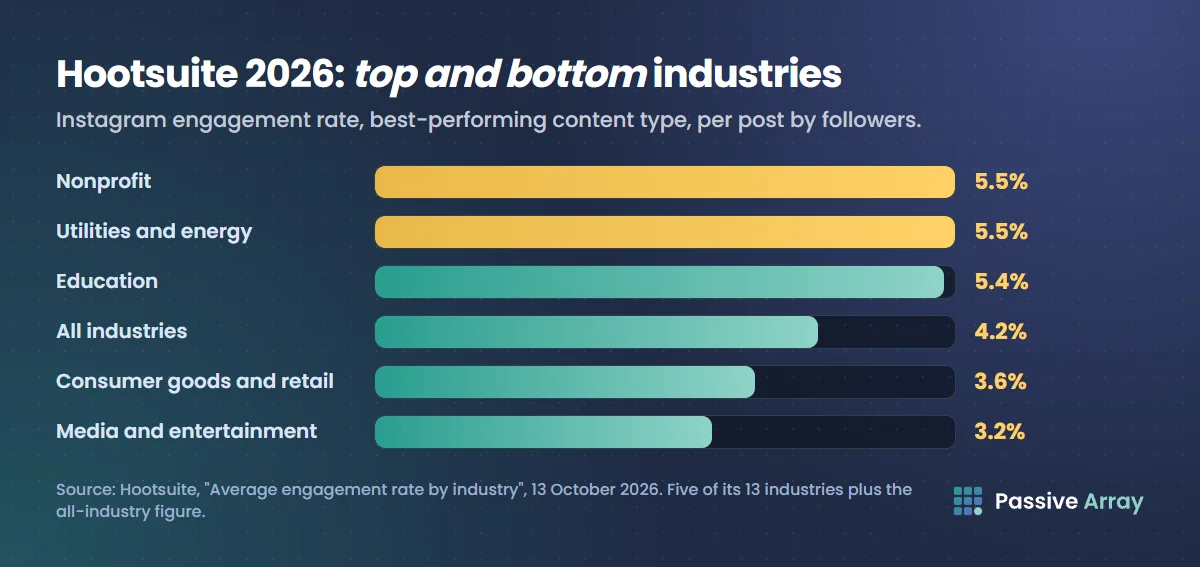
Instagram engagement rate by industry: Hootsuite 2026
Hootsuite published these figures on 13 October 2026. It says they "reflect each platform's best-performing content type, measured per post against follower count", using the formula total engagements divided by followers, times 100. Hootsuite does not state the sample size or the period the data covers.
| Industry (Hootsuite's grouping) | Instagram engagement rate |
|---|---|
| Nonprofit | 5.5% |
| Utilities and energy | 5.5% |
| Education | 5.4% |
| Construction, mining and manufacturing | 5.2% |
| Government | 5.0% |
| Healthcare, pharma and biotech | 4.5% |
| Technology | 4.2% |
| Financial services | 4.1% |
| Real estate, legal and other professional services | 4.1% |
| Dining, hospitality and tourism | 3.7% |
| Marketing agencies | 3.7% |
| Consumer goods and retail | 3.6% |
| Media and entertainment | 3.2% |
| All industries | 4.2% |
Hootsuite also lists a separate Instagram Reels engagement rate of 2.7% for media and entertainment, next to that industry's 3.2% Instagram figure. Its rule of thumb is that "a good engagement rate generally falls between 1% and 5%, depending on the platform and industry."
Quid (Rival IQ) 2026 Social Media Industry Benchmark Report
The long-running Rival IQ benchmark report is now published by Quid. The 2026 edition, published 5 March 2026, covers 18 industries: Alcohol, Automotive, Aviation, Beauty, Energy, Fashion, Financial Services, Food, Higher Education, Hotels and Resorts, Influencers, Media, Nonprofits, Pets, Pharma, Retail, Sports and Tech.
Its method:
- Formula: total interactions divided by follower count. Interactions include likes, comments, shares, reactions and video interactions.
- Sample: 150 companies chosen at random from each industry, from a database of over 200,000 companies, including organic and paid posts.
- Statistic: the median company in each industry, not the average.
What it reports for Instagram:
- The all-industry median fell from 0.36% to 0.30%, a drop of roughly 17% year over year.
- Higher Education and Sports led, both well above the median. Higher Education and Influencers "consistently outperform benchmarks, particularly on Instagram and TikTok."
- Retail and Beauty remained near the bottom.
- Energy made a strong debut in its first year in the report.
- Median posting frequency on Instagram declined for the second year in a row, to 3.69 posts per week.
The exact per-industry Instagram figures in this report are shown in charts and an interactive tool rather than in the article text, so we do not reproduce individual numbers here. Use the report itself if you need a specific industry's median.
Socialinsider 2026 Social Media Benchmarks
Socialinsider, a social analytics company, published its 2026 benchmarks in January 2026, with quarterly updates. It calculates Instagram engagement as likes plus comments on a post, divided by the profile's follower count, times 100, using organic posts from brand accounts.
- Instagram engagement rate: 0.50% in 2024 and 0.48% in 2025
- In its quarterly update, Socialinsider describes Instagram engagement as mostly flat, at an average of 0.45%
Socialinsider's article text does not give an Instagram breakdown by industry, so we only use its overall figures.
The three reports side by side
| Report | Year | All-industry Instagram figure | Formula | Accounts | Statistic |
|---|---|---|---|---|---|
| Hootsuite | 2026 | 4.2% | Total engagements / followers, per post | Not stated | Best-performing content type |
| Quid (Rival IQ) | 2026 | 0.30% | Total interactions / followers | 150 random companies per industry | Median |
| Socialinsider | 2026 (2025 data) | 0.48% | (Likes + comments) / followers | Brand accounts, organic posts | Average |
Why benchmark reports disagree so much
If all three divide by followers, how can one say 4.2% and another 0.30%? Five differences explain most of it.
1. Which posts are counted
Hootsuite measures each platform's best-performing content type. If Reels or carousels perform best on Instagram, that is the format the benchmark reflects. Quid and Socialinsider describe all the posts in their samples. A benchmark built on the best format will always be higher than one built on everything a brand posts, including weak announcements and ads.
2. Median or average
Quid uses the median company. Engagement is skewed: a few accounts with very high rates pull an average up, while the median is the middle account. In skewed data, the average is usually higher than the median, so a median-based report tends to show lower numbers.
3. Which interactions count
Socialinsider counts likes and comments. Quid counts a wider set of interactions, including shares and video interactions. Hootsuite counts total engagements. Counting more types of interaction raises the rate, all else equal.
4. Which accounts are in the sample
Quid samples established companies in each industry. Socialinsider uses brand accounts within a follower range. Hootsuite does not state its sample. Larger accounts have lower rates, so a sample of big brands will produce lower benchmarks than one with many small accounts, and none of these samples is made up mainly of individual creators.
5. How "industry" is defined
Hootsuite groups construction, mining and manufacturing together; Quid has separate Energy, Pharma and Higher Education categories, and even an Influencers category. The same company could sit in different groups in different reports, so "education" in one report is not the same set of accounts as "Higher Education" in another.
The practical lesson: never compare your rate with a benchmark calculated a different way. A brand with a 0.6% rate on all posts is doing well against Quid's 0.30% median and looks weak against Hootsuite's 4.2%, and only one of those comparisons uses the right ruler.
What the reports agree on
Despite the different numbers, a few patterns repeat:
- Instagram brand engagement has been drifting down. Quid reports a fall from 0.36% to 0.30%; Socialinsider from 0.50% to 0.48%.
- Education and mission-driven accounts do well. Higher Education leads in Quid's report; Education and Nonprofit are near the top of Hootsuite's table.
- Retail and consumer brands sit lower. Quid places Retail and Beauty near the bottom; Hootsuite places consumer goods and retail near the bottom of its table.
- Posting more does not mean engaging more. Quid notes Media, Sports, Beauty and Retail were the most active posters, yet Retail and Beauty sit near its bottom, and Hootsuite's media and entertainment figure is its lowest.
These directions are more reliable than any single number, because they hold across different methods.
Brand benchmarks versus creator benchmarks
All three reports describe brand accounts. Individual creators usually have higher rates, because their followers chose a person rather than a company, and most creator accounts are smaller. That is why the Passive Array tools use benchmarks by follower count rather than by industry for creators: roughly 4% typical under 10,000 followers, about 2% from 10,000 to 100,000, 1.4% to 500,000, 1.1% to a million and 0.8% above. Instagram engagement rate by follower count explains those tiers and how the grade is worked out.
So the right benchmark depends on who you are:
| You are | Compare against |
|---|---|
| A creator | Your follower tier, using the follower-count benchmarks |
| A brand account | An industry figure from one report, calculated with that report's formula |
| A brand vetting creators | The creator's tier, then their niche peers side by side |
Why some industries engage more than others
The reports describe what happened, not why. The reasons below are our reading of the patterns, not findings from the reports, but they help you judge whether an industry figure applies to you.
- Who follows the account. Students and alumni follow a university because they belong to it, and sports fans follow a team the same way. A follower who feels part of a community reacts more often than one who followed a shop for a discount code.
- What the posts are for. Retail and beauty brands post many product announcements and promotions. Those posts exist to sell, not to start a conversation, and they pull the rate down. Nonprofits and schools post stories about people, which invite reactions.
- How often they post. Quid notes that Media, Sports, Beauty and Retail post the most. More posts spread the same audience's attention across more items, so the rate per post tends to be lower even when total engagement is high.
- Account size. Industries made up of very large brands have lower rates for the same reason large creators do: reach as a share of followers shrinks as an account grows.
If your account is unusual for its industry, such as a small local shop with a loyal community, an industry median may understate what you can achieve. Your own trend, measured the same way each month, is the benchmark that fits you best.
Using an industry benchmark in a report
If you report Instagram results to a manager or a client, a benchmark makes the number meaningful. Keep it honest:
- Name the report, its year and its formula next to the figure, for example "Quid 2026, median, interactions divided by followers".
- Calculate your own number with that same formula and the same type of statistic.
- Show your trend over at least three periods next to the benchmark.
- Explain big gaps with a reason (a campaign, a format change, a giveaway) rather than leaving the reader to guess.
When a brand is choosing creators rather than reporting on its own account, industry benchmarks are the wrong tool. Compare each creator with their follower tier and with each other, as how to vet a creator before you pay them explains.
How to calculate your rate the way the benchmarks do
- Pick the report you will compare against and note its formula.
- Collect the same inputs. For Socialinsider-style numbers, use likes plus comments. For Quid-style numbers, add shares and other interactions from Insights.
- Use the same set of posts. For Quid or Socialinsider, use all posts in a period. For Hootsuite, its figure reflects the best-performing format, so compare it with your best format.
- Divide by followers and multiply by 100.
- Compare medians with medians. If the report uses the median, use your median post.
The engagement rate calculator does step 4 for likes and comments and grades the result against your follower tier. If like counts are your only reliable number, the likes to followers ratio is a simpler health check.
Worked example
This is a made-up example. Say a hotel brand has 40,000 followers, and over a month its 16 posts averaged 180 likes, 6 comments and 10 shares; the median post had 120 likes, 2 comments and 4 shares.
- Likes plus comments: (180 + 6) / 40,000 x 100 = 0.47%. Against Socialinsider's 0.48% all-brand figure, roughly typical.
- With shares added: (180 + 6 + 10) / 40,000 x 100 = 0.49%. Against Quid's 0.30% median, this looks above the middle of the pack, though the brand should also check its median post: about 126 interactions, or 0.32%.
- Against Hootsuite's 3.7% for dining, hospitality and tourism, it looks far below, but Hootsuite measures the best-performing content type, so the fair comparison is the brand's best format, not all 16 posts.
Same account, three different verdicts. The method decides the answer.
What is a good Instagram engagement rate for Reels?
None of these reports gives a cross-industry Reels-only benchmark in its article text, apart from Hootsuite's 2.7% for media and entertainment. Reels are also often judged by views rather than followers, because Instagram's ranking explainer says Reels are shown mostly to people who do not follow the account. For Reels, compare likes, comments and shares per view across your own Reels, and judge each new one against your recent median.
Using benchmarks without fooling yourself
- One report, one formula. Do not mix numbers from different reports in one comparison.
- Track your own trend. Your rate this quarter against last quarter, calculated the same way, tells you more than any industry figure.
- Look at the median post. One viral post can double an average.
- Do not chase a benchmark with bought engagement. It breaks Instagram's Community Guidelines and does not produce customers.
If your number is below where it should be, how to increase your Instagram engagement rate goes through the causes and fixes, and how to audit an Instagram account puts the rate in context with growth and audience quality. For other platforms, see TikTok engagement rate benchmarks and YouTube engagement rate benchmarks. Brands deciding whether a campaign worked can read does influencer marketing work, which covers what to measure beyond engagement.
Sources
- Hootsuite: Average engagement rate by industry, 13 October 2026
- Quid: 2026 Social Media Industry Benchmark Report, 5 March 2026
- Socialinsider: 2026 Social Media Benchmarks, January 2026
- Instagram: Instagram ranking explained, Adam Mosseri, 31 May 2023
- Instagram Help Center: Community Guidelines
Frequently asked questions
What is the average Instagram engagement rate by industry in 2026?
It depends on the report. Hootsuite's October 2026 figures range from 3.2% for media and entertainment to 5.5% for nonprofits and utilities, with an all-industry average of 4.2%. Quid's 2026 report puts the all-industry median for brands at 0.30%, with Higher Education and Sports highest and Retail and Beauty near the bottom.
What is a good engagement rate on Instagram in 2026?
For a creator, compare with your follower tier: roughly 4% is typical under 10,000 followers and under 1% above a million in the benchmarks our tools use. For a brand, compare with an industry figure from one report, calculated the same way. Hootsuite describes 1% to 5% as generally good, while Quid's brand median is 0.30%.
Why do Instagram engagement benchmarks differ between reports?
They count different posts (best-performing format or all posts), use different statistics (median or average), include different interactions (likes and comments only, or shares too), and sample different accounts. These choices can move the result by more than ten times, so only compare your rate with a benchmark calculated the same way.
Which industry has the highest Instagram engagement rate?
In Quid's 2026 report, Higher Education and Sports led, both well above the median. In Hootsuite's 2026 figures, nonprofits and utilities and energy were highest at 5.5%, followed by education at 5.4%. Education-related accounts rank near the top in both.
What is the industry standard Instagram engagement rate for brands?
There is no single standard. Quid's median for brands is 0.30% and Socialinsider's 2025 figure is 0.48%, while Hootsuite's best-format average is 4.2%. Pick one report, use its formula, and track your own trend against it.
What is a good engagement rate for Instagram Reels?
There is no cross-industry Reels benchmark in these reports' article text, apart from Hootsuite's 2.7% for media and entertainment. Because Reels reach mostly non-followers, compare engagement per view across your own Reels and judge each one against your recent median.
Is there an Instagram engagement rate benchmark calculator?
Yes. The Passive Array benchmark tool places any engagement rate on the follower-tier table and says whether it is low, average, good or excellent for that size. It is free and needs no account. For brand-versus-industry comparisons, use the report tables above with the matching formula.